
Real-time machine monitoring platforms help manufacturers track machine status, production counts, cycle times and downtime. By collecting data from PLCs, controllers or sensors, they provide visibility into shop-floor performance and support Overall Equipment Effectiveness (OEE) analysis.
This guide compares eight real-time machine monitoring platforms for manufacturing in 2026: MachineMetrics, Vorne XL, Amper, Evocon, Ignition with Sepasoft OEE Downtime, Litmus Edge, Tulip and Iotellect. It examines ten criteria, including PLC and legacy equipment connectivity, OEE, dashboards, edge and offline operation, MES and ERP integration, and predictive-maintenance capabilities. The comparison uses public vendor documentation. Iotellect, which publishes this guide, is one of the eight platforms covered; the order is not a ranking.
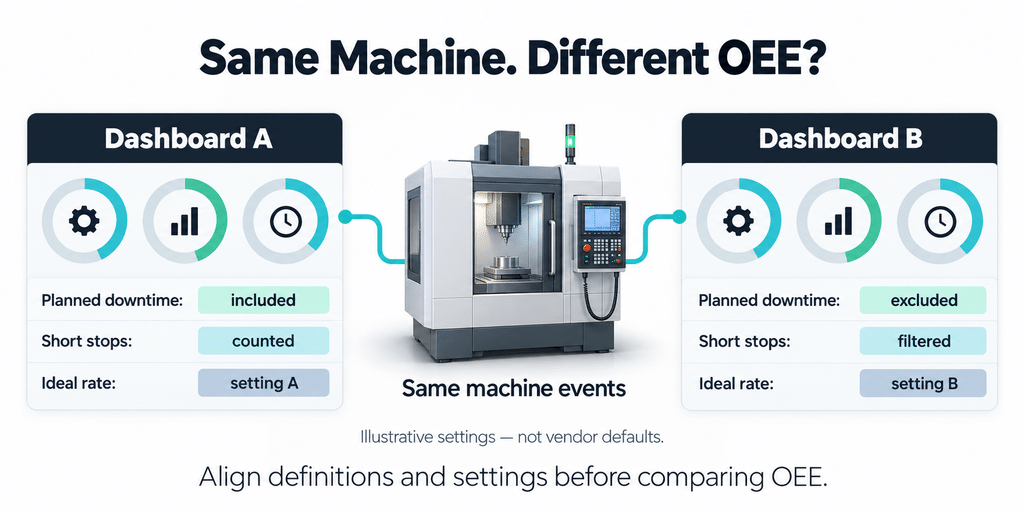
The best fit depends on your equipment, deployment requirements and who will configure and maintain the system. Some products include OEE in their core offering, while others deliver it through a module, plan or app. Even the same machine on the same shift can produce different OEE figures if tools handle planned downtime differently. Compare connection paths and OEE settings before choosing a platform.
How this comparison was built
Selection. The comparison covers specialized machine-monitoring products and broader manufacturing platforms. Eight entries were chosen based on the depth of their public documentation against the ten criteria used below.
Sources. Table cells and vendor statements draw on each vendor’s official pages and documentation. Category explanations draw on standards, government publications and peer-reviewed research. The grouping and buyer questions are editorial judgments. No listicles, review sites, resellers or forums were used.
Cell vocabulary. “Documented” means the vendor’s public pages describe the capability. “Via add-on, module or partner” identifies a separate component that provides it. “Not stated in public docs” means the capability was not described in the documentation reviewed; it does not mean the capability is absent.
Amper. Only public documentation was reviewed. Amper’s installation guides on the ECI customer portal are not covered.
Limits. There was no hands-on testing for this guide, so a documented capability does not guarantee compatibility with your machines. The two groups reflect where each entry provides OEE and are not mutually exclusive. OEE figures should not be compared across tools without checking that their definitions, data inputs and calculation settings match. Vendor setup times and prices are not compared.
What to Compare First: Connection Path and OEE Settings
In this guide, real-time refers to manufacturing operations monitoring at ISA-95 Level 3, the MES layer. Information becomes available within seconds of shop-floor events. This differs from the faster response requirements of machine-control systems.
The comparison distinguishes controller-protocol connections, gateway or adapter connections, and discrete I/O or current-sensor connections. Buyers should check what data each machine exposes and whether the platform supports that connection path.
Serial Modbus devices, for example, typically need a gateway to communicate with Modbus TCP systems. Discrete I/O can provide activity signals and production counts, but it may not expose controller alarms or detailed process data. The available information also depends on the machine’s configuration and installed options.
OEE also needs planning data that the machine usually does not hold. The OPC Foundation’s OPC 40501-1, drawing on ISO 22400-2:2014, explains that planned busy time and planned run time per item usually come from MES or ERP rather than the machine. Research by Schiraldi and Varisco (2020) also identifies differences between OEE definitions within ISO 22400.
Vendors add their own settings. Evocon allows planned-stop reasons to affect OEE differently, MachineMetrics provides planned-downtime exclusion settings, and Sepasoft uses a configured standard production rate.
Two tools that both calculate OEE can therefore report different numbers for the same shift. Compare OEE definitions and inputs—including planned time, short-stop handling, ideal rate and quality counts—before comparing results.
Real-Time Machine Monitoring Platforms Compared on Ten Criteria
The tables use the three descriptions defined in the methodology section. Criterion 10, best use case and limitations, appears in each platform section.
Table 1. Connectivity, monitoring, cycle time, OEE and dashboards
| Platform | PLC and legacy machine connectivity | Machine-state and production-counter monitoring | Cycle-time and downtime tracking | OEE calculation | Alarms and dashboards |
|---|---|---|---|---|---|
| MachineMetrics (MaximaOS) | Documented: native MTConnect, FOCAS, OPC UA, S7 and Modbus | Documented: live machine status, execution state and part counts | Documented: cycle time versus expected, downtime reasons and microstop settings | Documented: Availability × Performance × Quality; planned-downtime exclusion setting | Documented: desktop, tablet and TV dashboards; configurable alerts |
| Vorne XL | Documented: sensor or PLC signal input. Via module: Data Link PLC | Documented: production state; good, reject and total counts | Documented: cycle times, small stops and barcode downtime reasons | Documented: OEE, Availability, Performance and Quality; ideal cycle time | Documented: local reports and dashboards. Via add-on: XL Enterprise email and text alerts |
| Amper | Documented: non-invasive sensors, aggregators and PLC integrations | Documented: uptime, downtime, scrap and cycle counts; ECI package scope varies | Via module: Production Intelligence for ECI customers, covering cycle time, output and downtime analysis | Documented: A/P/Q analytics and OEE in general plans. Via module: Production Intelligence for ECI-customer OEE | Documented: real-time alerts and dashboards |
| Evocon | Documented: PLC output via relay, sensors and HTTPS import | Documented: run/stop states and produced quantities | Documented: automatic downtime capture and operator-entered stop reasons | Documented: Availability × Performance × Quality; per-reason planned-stop setting | Documented: dashboards; downtime alerts in Professional and Enterprise |
| Ignition + Sepasoft OEE Downtime | Documented through Ignition: drivers for Allen-Bradley, Siemens S7, Modbus, Omron and Mitsubishi | Via Sepasoft module: mode, state and counts | Via Sepasoft module: cycle times, downtime events and short-stop threshold | Via Sepasoft module: Availability × Performance × Quality; planned-downtime handling | Documented: tag alarms; dashboards and notifications through Ignition modules |
| Litmus Edge | Documented: native drivers including Allen-Bradley, Fanuc, Siemens and MTConnect | Documented: machine-state ingestion; configurable counter KPI in Growth | Documented: cycle-time KPI in Growth; downtime reason codes in reference architecture | Documented: OEE from A/P/Q logic in Growth | Documented: configurable rules, alerts and flow dashboards |
| Tulip | Via Machine Monitoring add-on: OPC UA and MQTT connectors; Edge IO/MC devices | Via add-on: Running, Stopped and Idle states; part and defect counts | Via add-on: default and custom downtime reasons; cycle-time attribute | Via Library apps: Simple OEE Dashboard and OEE Calculator for manual processes | Via apps and Automations: dashboards and downtime email rules |
| Iotellect | Documented: Modbus, OPC UA and EtherNet/IP; OPC Agent for DA/AE/HDA | Via Iotellect MES: cycle times, output counts and equipment performance | Via Iotellect MES: downtime events with reason codes and cycle times | Via Iotellect MES: editable OEE per line, shift or product | Documented: browser operator screens, scheduled reports and alerts |
Table 2. Edge operation, integration, maintenance and brownfield deployment
| Platform | Edge and offline operation | MES and ERP integration | Predictive-maintenance capabilities | Brownfield deployment |
|---|---|---|---|---|
| MachineMetrics (MaximaOS) | Documented: temporary buffering while powered and receiving machine data | Documented: core APIs. Via module: Intelligent MES bidirectional ERP integration | Documented: thresholds and custom ML on high-frequency controller data | Documented: sensor and relay connections for older machines |
| Vorne XL | Documented: on-site appliance and built-in database; no cloud requirement | Documented: XL API. Via module: Data Link ERP integration tool | Not stated in public docs | Documented: one or two sensor inputs; installation by a qualified electrician |
| Amper | Not stated in public docs | Documented: pre-built ERP and MES integrations; ECI ERP connection | Via add-on: Maintenance Management for usage-based preventive maintenance. ECI also describes an AI copilot for performance and issues | Documented: sensor approach for equipment of different ages and makes |
| Evocon | Not stated in public docs | Via Integrations add-on: ERP work assessed case by case | Via partner: Arpedon MAINTNODE condition-based maintenance | Documented: product-detection sensor or hardware-free HTTPS route |
| Ignition + Sepasoft OEE Downtime | Documented: on-site gateway and store-and-forward for database writes | Via Sepasoft modules: Business Connector and Interface for SAP ERP | Via add-on: Sepasoft SepaIQ platform and Machine Learning Module | Documented through platform drivers: networked legacy PLCs including PLC-5, SLC and MicroLogix |
| Litmus Edge | Documented: local analytics; optional store-and-forward per connector | Documented: SQL Server, PostgreSQL and REST connectors | Documented: predictive analytics; edge ML serving in Growth | Documented: legacy and modern protocols; IPC, VM, Docker and Kubernetes deployment |
| Tulip | Documented: OPC UA outage queue; stable cloud connection required | Via connectors: HTTP, SQL and APIs; SAP S/4HANA template | Via partner: Augury connector for status and alerts | Via add-on hardware: Edge IO, current transformer and break-beam sensors |
| Iotellect | Documented: edge and on-premise nodes operate during connectivity drops; edge buffering | Via Iotellect MES: ERP integration through an ISA-95 data structure | Documented: tooling to train ML models and estimate remaining useful life | Documented: edge servers and low-code drivers for simple protocols |
Machine Monitoring Products with OEE in the Core Product
These four products document OEE and downtime tracking as part of the monitoring product itself. Each still requires site configuration of shifts, reason codes and sensors.
For ECI ERP customers, Amper places cycle time and OEE in its Production Intelligence package. MachineMetrics also documents building and modifying applications within MaximaOS.
MachineMetrics (MaximaOS)
MachineMetrics describes MaximaOS as an AI-powered operating system for discrete manufacturing. It documents native MTConnect, FANUC FOCAS, OPC UA, Siemens S7 and Modbus TCP connections. Some connections require controller options, such as a FOCAS licence. Sensor and relay connections provide an alternative for older machines.
The platform shows live machine status, cycle time against expected values and categorized downtime. OEE is calculated as Availability × Performance × Quality, with settings for excluding planned downtime. Dashboards run on desktop, tablet and TV displays, with configurable alerts.
MachineMetrics is cloud-based. During an internet outage, its Edge device can temporarily buffer data while it remains powered and continues receiving machine data over the local network. Power loss or local network failures can prevent data capture.
For maintenance, it documents health thresholds and a high-frequency route that feeds 1 kHz controller data into machine-learning models. Custom algorithms can be deployed to its Edge devices.
Best for: discrete manufacturers running supported CNC controls, including FANUC, Okuma and Mazak.
Limitations: temporary buffering requires a powered Edge device that continues receiving machine data, and retention is not guaranteed during extended outages. The I/O route captures activity and cycles rather than controller internals. Bidirectional ERP integration is listed under the Intelligent MES package.
Vorne XL (XL Productivity Appliance)
Vorne Industries’ XL Productivity Appliance provides preconfigured production monitoring and performance management functionality. It reads signals from an existing photo-eye, relay, PLC or proximity switch. Vorne also lists a separate Data Link PLC tool.
The XL tracks production state, cycle times, small stops, and good, reject and total counts. It reports OEE against an ideal cycle time. Email and text alerts are available through XL Enterprise, an optional cloud-based add-on.
The appliance has a built-in database and does not require the cloud. XL devices operate within the plant’s firewall. For ERP integration, Vorne lists a Data Link ERP tool. The XL API is available on devices with software version 2.0 or later.
Best for: production processes that provide counts or cycles.
Limitations: the XL is not intended for control applications and must be installed by a qualified electrician. API integration may require an experienced software developer. Predictive maintenance is not stated in the public documentation reviewed.
Amper (ECI Software Solutions)
ECI Software Solutions announced its acquisition of Amper Technologies on December 9, 2025. ECI describes Amper’s sensor approach as suitable for equipment of different ages and makes, and separately lists PLC integrations.
Amper tracks uptime, downtime, OEE, scrap and cycle counts. Its OEE analytics cover Availability, Performance and Quality, alongside real-time alerts and dashboards.
Data travels to the cloud through an encrypted cellular connection. Offline operation is not stated in the public documentation reviewed. ECI also describes pre-built ERP and MES integrations.
Maintenance Management is an add-on module that schedules preventive maintenance based on actual machine operating hours. This is usage-based preventive maintenance. ECI separately describes an AI copilot that summarizes and predicts performance and issues.
Best for: continuous-improvement and operations teams working with equipment of mixed age and make.
Limitations: offline operation is not stated in public documentation. ECI customers receive cycle time and OEE through a named package, maintenance is an add-on, and pricing is by custom quote.
Evocon
Evocon is a cloud-based solution for OEE and downtime tracking. A product-detection sensor or PLC output connected through a relay provides the signal. Its documentation also describes a hardware-free route for importing existing data through HTTPS requests.
Evocon records machine run/stop states and produced quantities, captures downtime automatically and lets operators categorize it. OEE is calculated as Availability × Performance × Quality, with configurable handling of planned-stop reasons.
The platform provides customizable dashboards. Downtime alerts are listed in its Professional and Enterprise plans.
Integrations are an add-on, and ERP integration requirements are assessed case by case.
For maintenance, Evocon documents a partner route through Arpedon’s MAINTNODE condition-based maintenance system. This requires additional hardware near the production line, and fees may apply.
Best for: production involving large quantities of standardized products.
Limitations: Evocon identifies custom, one-off work as a less suitable use case and does not offer custom development as a paid service. Edge and offline operation are not stated in the public documentation reviewed.
Platforms Where OEE Comes as a Module, Plan or App
For these four platforms, OEE is delivered through a named module, plan tier or app: Sepasoft OEE Downtime, the Litmus Growth plan, Tulip Library apps and Iotellect MES. A plant team or an integrator configures the application.
Ignition + Sepasoft OEE Downtime
This is a two-vendor stack. Inductive Automation’s Ignition platform provides PLC and database connectivity, including drivers for Allen-Bradley over EtherNet/IP, Siemens and Modbus TCP. OEE comes from Sepasoft, a separate technology provider.
Sepasoft’s OEE Downtime module collects production counts, cycle times and downtime events. It records machine mode and state and calculates OEE as Availability × Performance × Quality, with configurable production rates and planned-downtime handling.
Alarms, dashboards and notifications come from Ignition modules.
Ignition’s Store and Forward holds data before it is written to a database, helping protect against network and database failures. For ERP integration, Interface for SAP ERP is an add-on to Sepasoft’s Business Connector. SAP integration requires early coordination with the SAP team.
For predictive maintenance, Sepasoft’s separate SepaIQ platform connects to Ignition and provides machine-learning capabilities for predicting losses, failures and quality issues.
Best for: manufacturers and integrators building OEE and MES applications on Ignition.
Limitations: Sepasoft MES modules require the Ignition platform. Module versions must be compatible, and visualization modules are separate price-list items.
Litmus Edge
Litmus describes Litmus Edge as an industrial edge data platform. Its drivers cover serial, Ethernet, SocketCAN and file-based protocols. Its connection guide includes Allen-Bradley, Fanuc, Siemens and MTConnect.
Deployment options include an industrial PC, virtual machine, Docker and Kubernetes.
Litmus Edge ingests production and machine-state data and offers configurable counter and cycle-time KPIs. Its OEE reference architecture includes Availability, Performance and Quality calculations, downtime tracking, reason codes and bottleneck detection. Flows provide rules, alerts and dashboards.
Analytics and applications execute locally, with optional store-and-forward behavior per connector. Integration options include SQL Server, PostgreSQL and REST.
Litmus also documents maintenance analytics for predicting machine or component failures.
Best for: teams seeking to standardize industrial data architecture across multiple plants.
Limitations: building and maintaining flows requires familiarity with JSON and Node-RED. Ready-made manufacturing KPIs and edge ML model serving are listed in the Growth plan.
Tulip (Machine Monitoring Add-on)
Tulip is a cloud-based Frontline Operations Platform. Machine Monitoring is an add-on. Machines, or an existing OPC or SCADA layer, connect through OPC UA and MQTT connectors. Edge IO provides an additional sensor-based connection route.
Machine types define states such as Running, Stopped and Idle, along with downtime reasons and attributes. Dashboards can display part and defect counts.
OEE comes through Library apps. The Simple OEE Dashboard provides an example that may need changes for a specific implementation, while the OEE Calculator supports manually tracked processes.
Tulip Cloud deployments require a stable network connection. Its documentation describes OPC UA queuing during outages, but events exceeding queue limits can be lost. Integration options include table APIs and an SAP S/4HANA template.
The Augury connector provides a partner route that can be extended for predictive-maintenance use cases.
Best for: frontline applications that combine information from operators and machines.
Limitations: Tulip Edge IO/MC devices cannot run Tulip Player. Tulip also identifies the edge-device retrofit approach as less preferable for larger deployments.
Iotellect
Iotellect is a low-code IIoT platform for building custom Industry 4.0 and smart manufacturing solutions. Its MES offering provides ready-to-use modules on a fully editable low-code core.
Its connectivity documentation lists Modbus, OPC UA and EtherNet/IP. OPC DA, AE and HDA are available through a standalone Windows OPC Agent. A low-code Flexible Driver supports relatively simple protocols, and supported native connections can reduce the need for additional converters or gateways.
Iotellect MES tracks cycle times and downtime events with reason codes. OEE can be broken down by line, shift or product, with editable calculations.
In a hybrid setup of edge, on-premise and cloud nodes, each node can operate independently during connectivity drops. Edge servers buffer data awaiting transmission to the cloud. ERP systems such as SAP connect through a consistent data structure.
For maintenance, Iotellect’s predictive maintenance capabilities include tooling for training machine-learning models and estimating remaining useful life.
Best for: system integrators and manufacturing teams that want to build and customize monitoring and manufacturing applications.
Limitations: custom monitoring applications require configuration and development work. Plants need appropriate low-code, automation, SCADA/HMI or data-science skills in-house, or support from an integrator. Specific planned-time and ideal-rate settings, MTConnect and FANUC FOCAS support were not identified in the public documentation reviewed.
How to Choose a Machine Monitoring Platform by Buyer Type
Build versus buy is a spectrum. Options include preconfigured products, configurable modules and apps, integrator packages and custom applications. One offering can support more than one approach.
Every option requires site work. Machines, shifts, reason codes and production rates must be configured before monitoring results can be trusted. Platform upgrades may also require application changes and testing.
The deciding question is ownership after go-live: who configures shifts, reason codes, planned stops and ideal rates? Who updates those settings and tests upgrades?
An application should have a named party responsible for configuration, changes and upgrade testing.
Manufacturers
Start with your machine list and the connection path each machine allows. Ask each vendor:
- Which signal does the system read on your machines?
- Which states, counts and reasons does that signal support, and what must operators enter?
- What must be configured at each site before the OEE figure can be trusted?
OEMs
An OEM largely determines what protocol-based monitoring can read. It should therefore specify both the enabled connection interface and the machine-data model.
Examples include an OPC UA machinery state model, an MTConnect adapter and PackML tags. Standardized data models and naming conventions help monitoring applications interpret machine information consistently.
An OEM shipping its own monitoring application should also establish who owns its code and who maintains it.
System Integrators
Integrators turn platforms into application packages. Iotellect’s case study describes SMITEC’s SWM suite, developed for SMI Group on the Iotellect SCADA/HMI platform. It supports live monitoring and OEE KPI analytics, with PLC or PAC data commonly carried over Modbus/TCP or OPC.
Ask how much of a proposed package is configuration and how much is custom code. Confirm who owns its logic and intellectual property, and who keeps it compatible with platform upgrades.
Before You Sign
Four contract questions apply to every entry:
- Can raw events and reason codes be exported through an API in an open format?
- What notice period and data-retrieval window apply if a product is discontinued?
- Can sensors and gateways be reused?
- For platform-plus-module stacks, what are both vendors’ version-support policies?
Where Iotellect Fits
Iotellect combines a low-code Industry 4.0 platform with ready-made MES modules on an editable core. This suits teams and integrators that want to configure and extend application logic.
Plants should confirm which application changes and maintenance tasks the vendor or integrator will handle.
Frequently Asked Questions
What is the best platform for real-time machine monitoring?
The best platform depends on your machines, connection requirements, deployment environment and integration needs. MachineMetrics, Vorne XL, Amper and Evocon provide monitoring products with OEE capabilities, while Ignition with Sepasoft, Litmus Edge, Tulip and Iotellect provide broader platforms with OEE delivered through modules, plans or apps.
For manufacturing operations monitoring, real-time generally means information available within seconds. Machine-control loops have faster response requirements.
Can machine-monitoring platforms connect to legacy PLCs and equipment?
Many platforms support legacy equipment through compatible controller drivers, gateways, adapters or sensor-based connections. A native connection depends on the controller interface, platform driver and any required machine options.
Sensor or discrete I/O connections may capture activity and production counts without exposing controller alarms or detailed process values. Check the data available from each machine before selecting the platform.
What is the difference between machine monitoring and OEE software?
Machine monitoring turns equipment signals into machine states, production counts and events. OEE software combines those inputs with production schedules, ideal rates and quality data to calculate equipment effectiveness.
The categories overlap because many monitoring platforms also calculate OEE. Meaningful comparisons require consistent definitions for planned time, short stops, ideal production rates and quality counts.
Can machine-monitoring software operate at the edge without internet access?
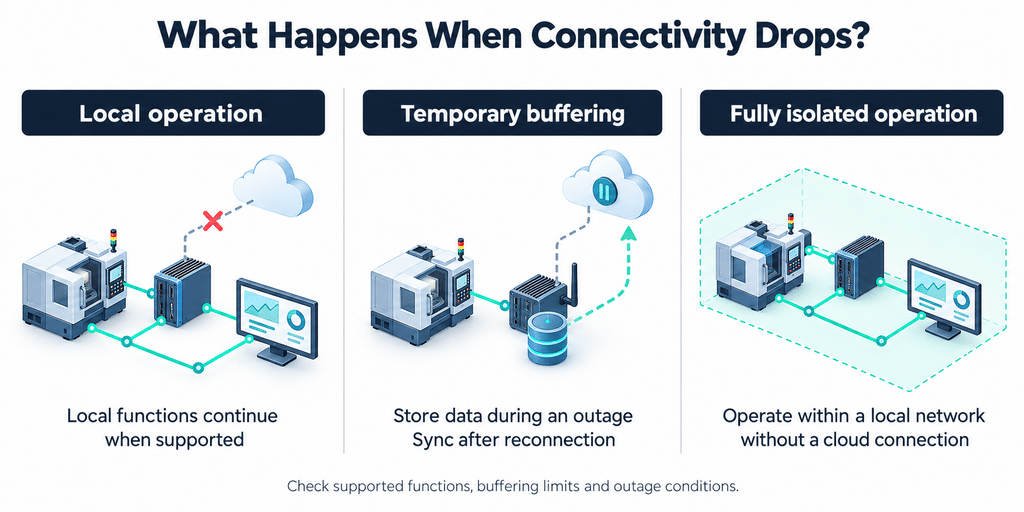
Some platforms support local operation, while others provide temporary buffering during internet outages. These capabilities differ from fully isolated operation.
Check whether dashboards, rules and data collection continue locally, how much data can be buffered, and what happens during power or local network failures. The comparison table identifies documented behavior and documentation gaps.
How does machine monitoring integrate with MES and ERP systems?
Machine monitoring supplies equipment states, counts and production events to MES and ERP systems through APIs, database connections, named connectors or partner integrations.
MES typically manages manufacturing operations at ISA-95 Level 3, while ERP manages business planning at Level 4. Production orders can flow toward the shop floor, and production results can flow back to business systems.
Confirm whether the proposed integration includes order context, production confirmations and bidirectional data exchange, rather than only exporting machine values.
Can machine-monitoring data be used for predictive maintenance?
Yes. Machine-state and production-count data can support usage-based preventive maintenance, threshold alerts and predictive models. More advanced prediction may require condition data such as vibration, temperature, current or high-frequency controller signals.
Predictive maintenance combines historical performance or reliability data with current equipment condition to estimate failure risk or timing. A monitoring platform’s maintenance capabilities should therefore be assessed separately from its OEE features.